Building dashboards
Last updated: October 23, 2026
Dashboards let you create interactive, shareable data visualizations directly from a conversation with WRITER Agent.
Before creating a dashboard, answer these questions:
Who is this dashboard for? (e.g., executive leadership, a sales team, a cross-functional operations group)
What should they take away from it? (key metrics, trends, or decisions)
What does a good result look like? (chart types, filters, data sources, brand look, layout sections)
How to create a dashboard
You can create a dashboard using the /dashboard command in chat or by selecting it from the plus menu.
WRITER Agent can detect when you want a dashboard from your prompt alone, but selecting Dashboard mode or typing /dashboard gives you the most consistent results.
You can also speak your prompt instead of typing it. Select the microphone icon and talk through your audience, metrics, and data sources. Review the transcript before submitting.
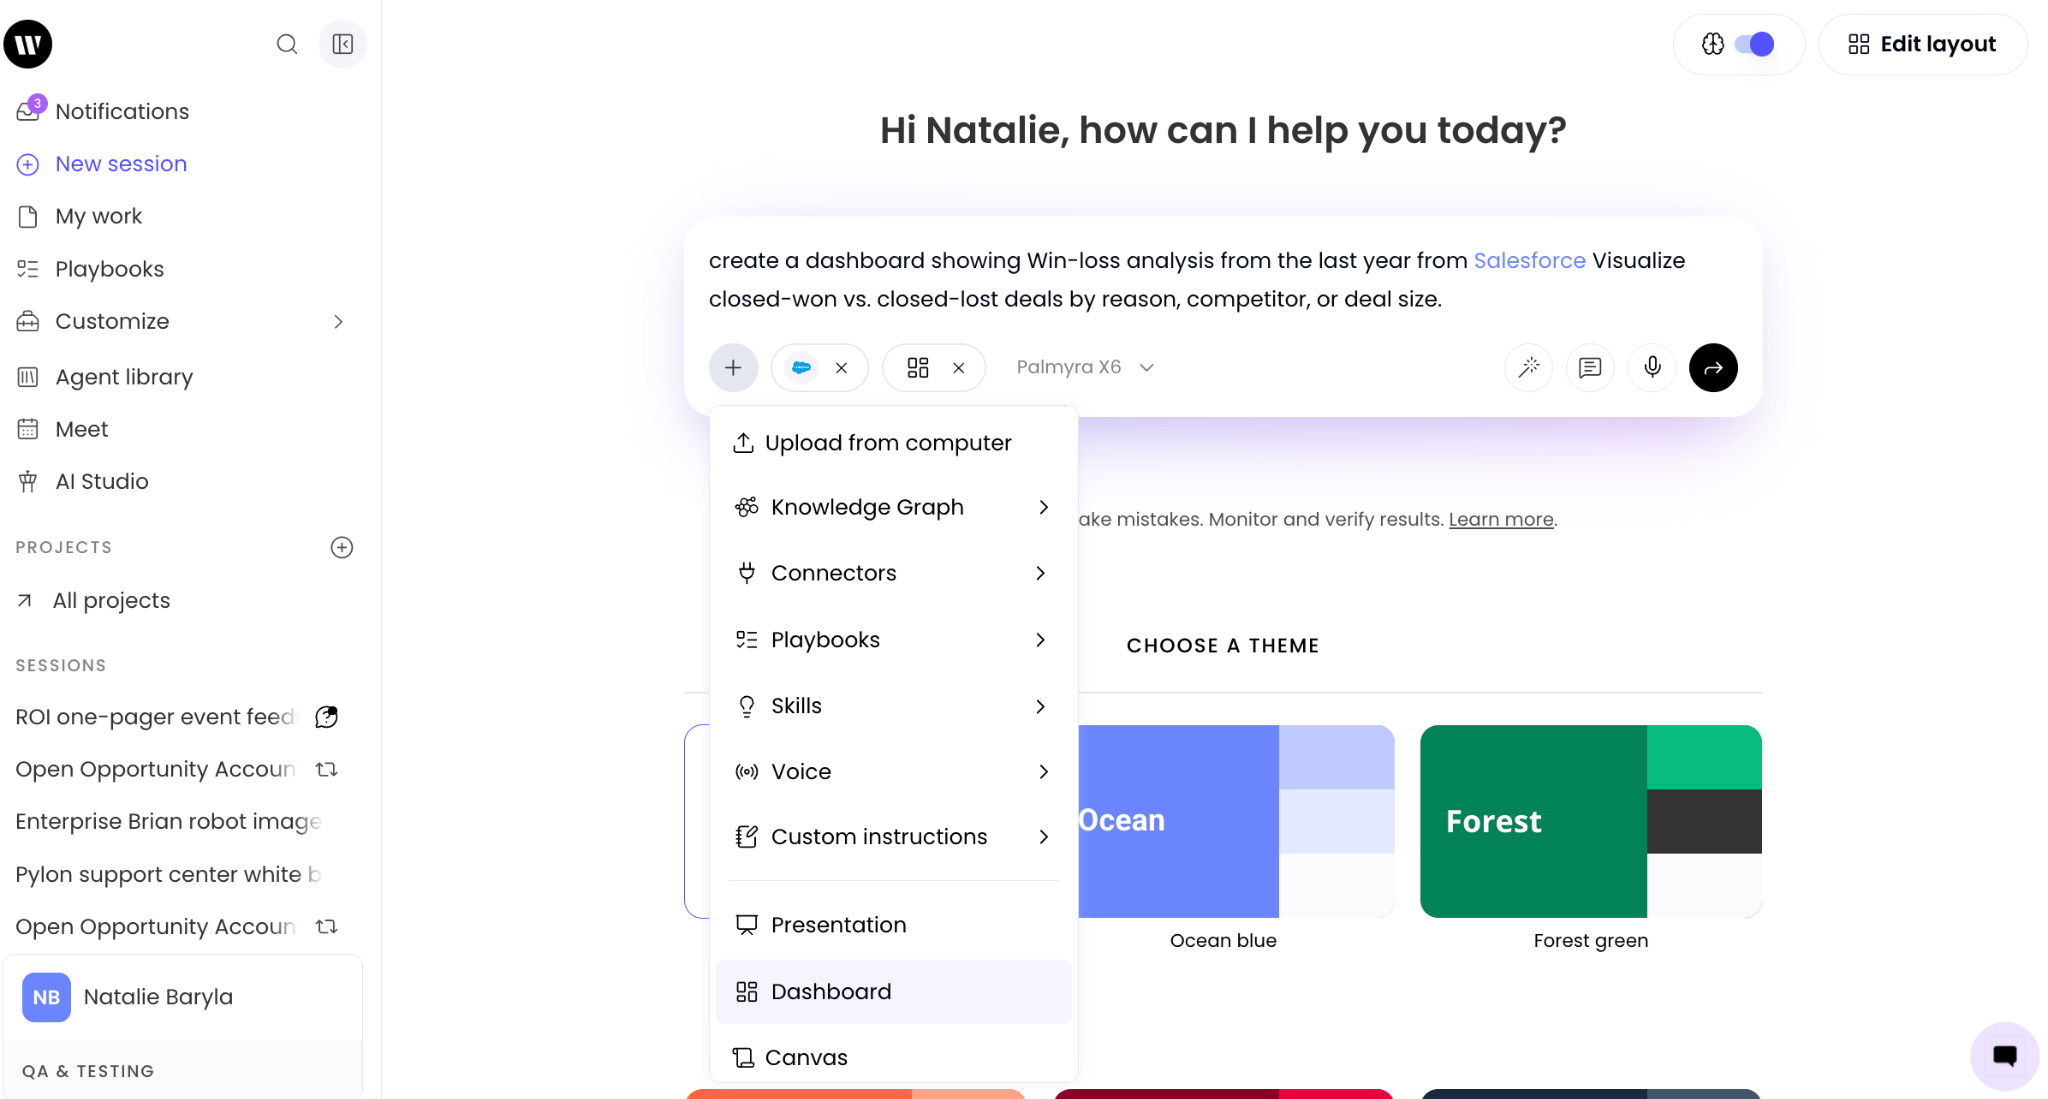
Open a new or existing chat with WRITER Agent.
Type /dashboard in the message field.
Describe the dashboard you want to create, including the data you want to visualize and any specific layout preferences.
Press Enter or select the Send button to submit your request.
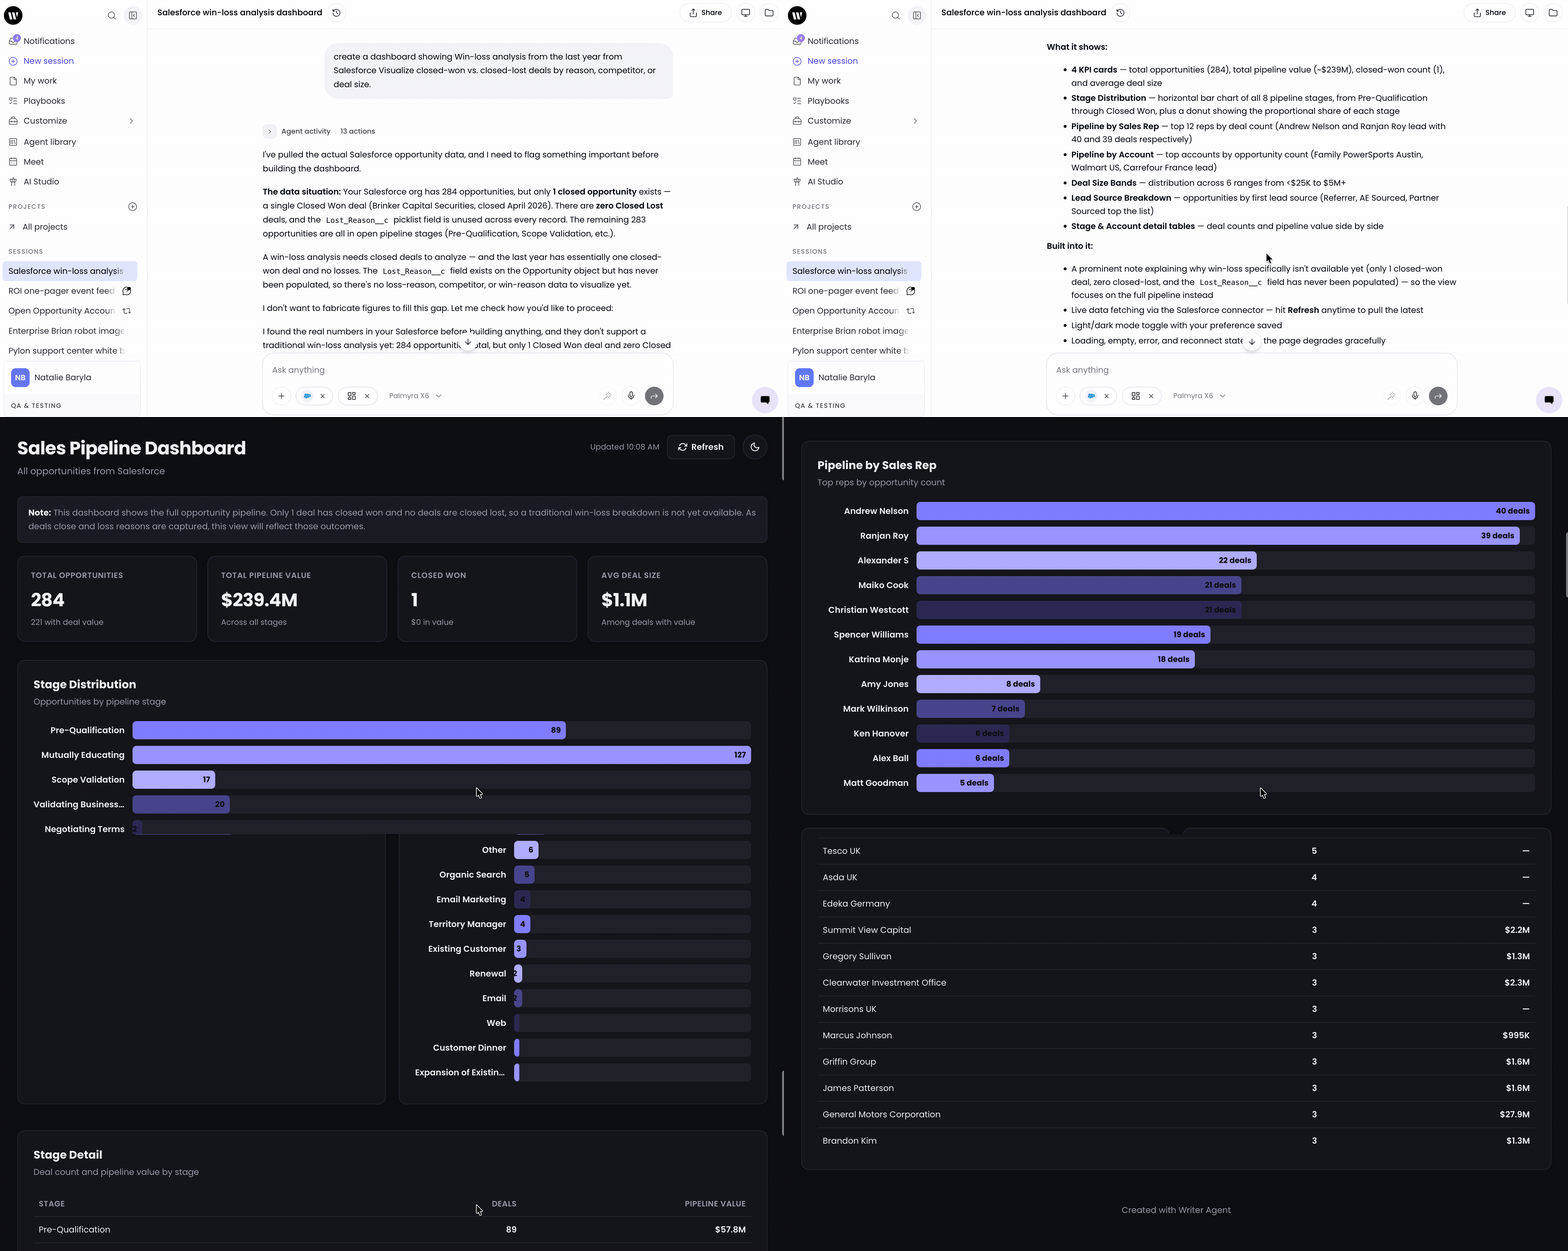
WRITER Agent generates your dashboard and opens it to verify it rendered correctly. You'll see a preview of your dashboard along with a deliverable card showing the dashboard details.
Some examples of dashboard prompts you can try:
"Build a Q3 pipeline dashboard from this CSV with deal value by stage, rep, and close quarter."
"Create a campaign performance dashboard with channel, week, and geography breakdowns from our Google Sheets connector."
"Build a status dashboard that pulls the latest open deals from Salesforce and refreshes when someone opens the page."
Tip: Be specific about the metrics, charts, and layout you want. Include details about time ranges, comparisons, or groupings to get more accurate results.
Choosing a theme
Every dashboard uses a WRITER theme that controls its visual appearance. You can select a theme during creation or change it after the dashboard is generated.
If your organization uses Assets or a style guide, ask WRITER Agent to follow those brand colors, fonts, and logos when it builds the page.
Available themes
WRITER provides the following built-in themes:
Theme | Description |
Default | Standard WRITER styling with a clean, professional appearance |
Ocean blue | Blue color palette with cool tones |
Forest green | Green color palette with natural tones |
Sunset | Warm orange and coral tones |
Rose | Pink and burgundy color palette |
Slate | Gray and neutral tones for a subdued look |
While these are the themes automatically available in WRITER, you're able to add your own. Consider creating a skill to contain your branding guidelines like fonts and colors. You can then use that skill when creating any kind of deliverable in WRITER not just dashboards. Learn more about skills here.
Selecting a theme during creation
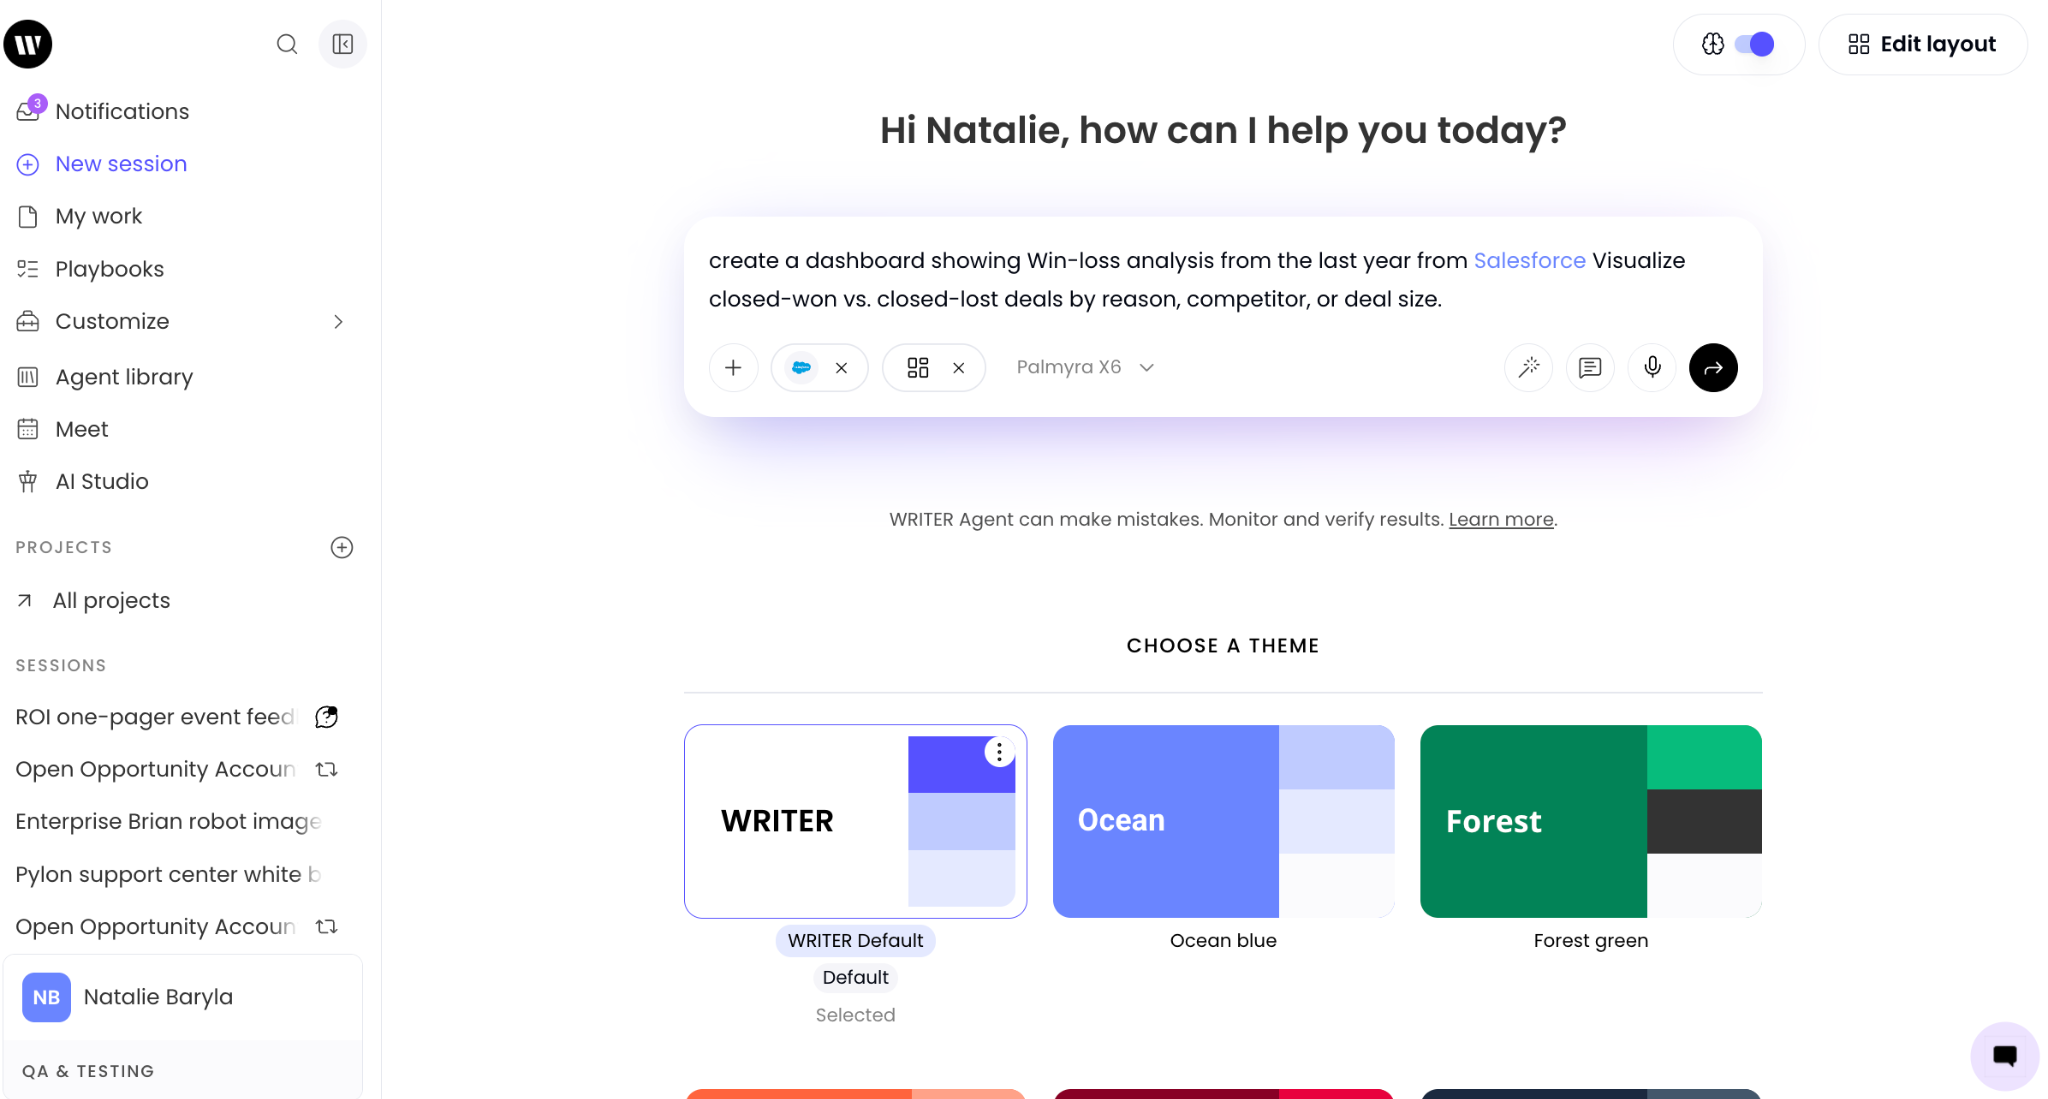
After initiating a dashboard request, WRITER Agent displays the Choose a theme selector.
Select the theme card that matches your preferred style.
The dashboard generates using your selected theme.
Changing the theme after creation
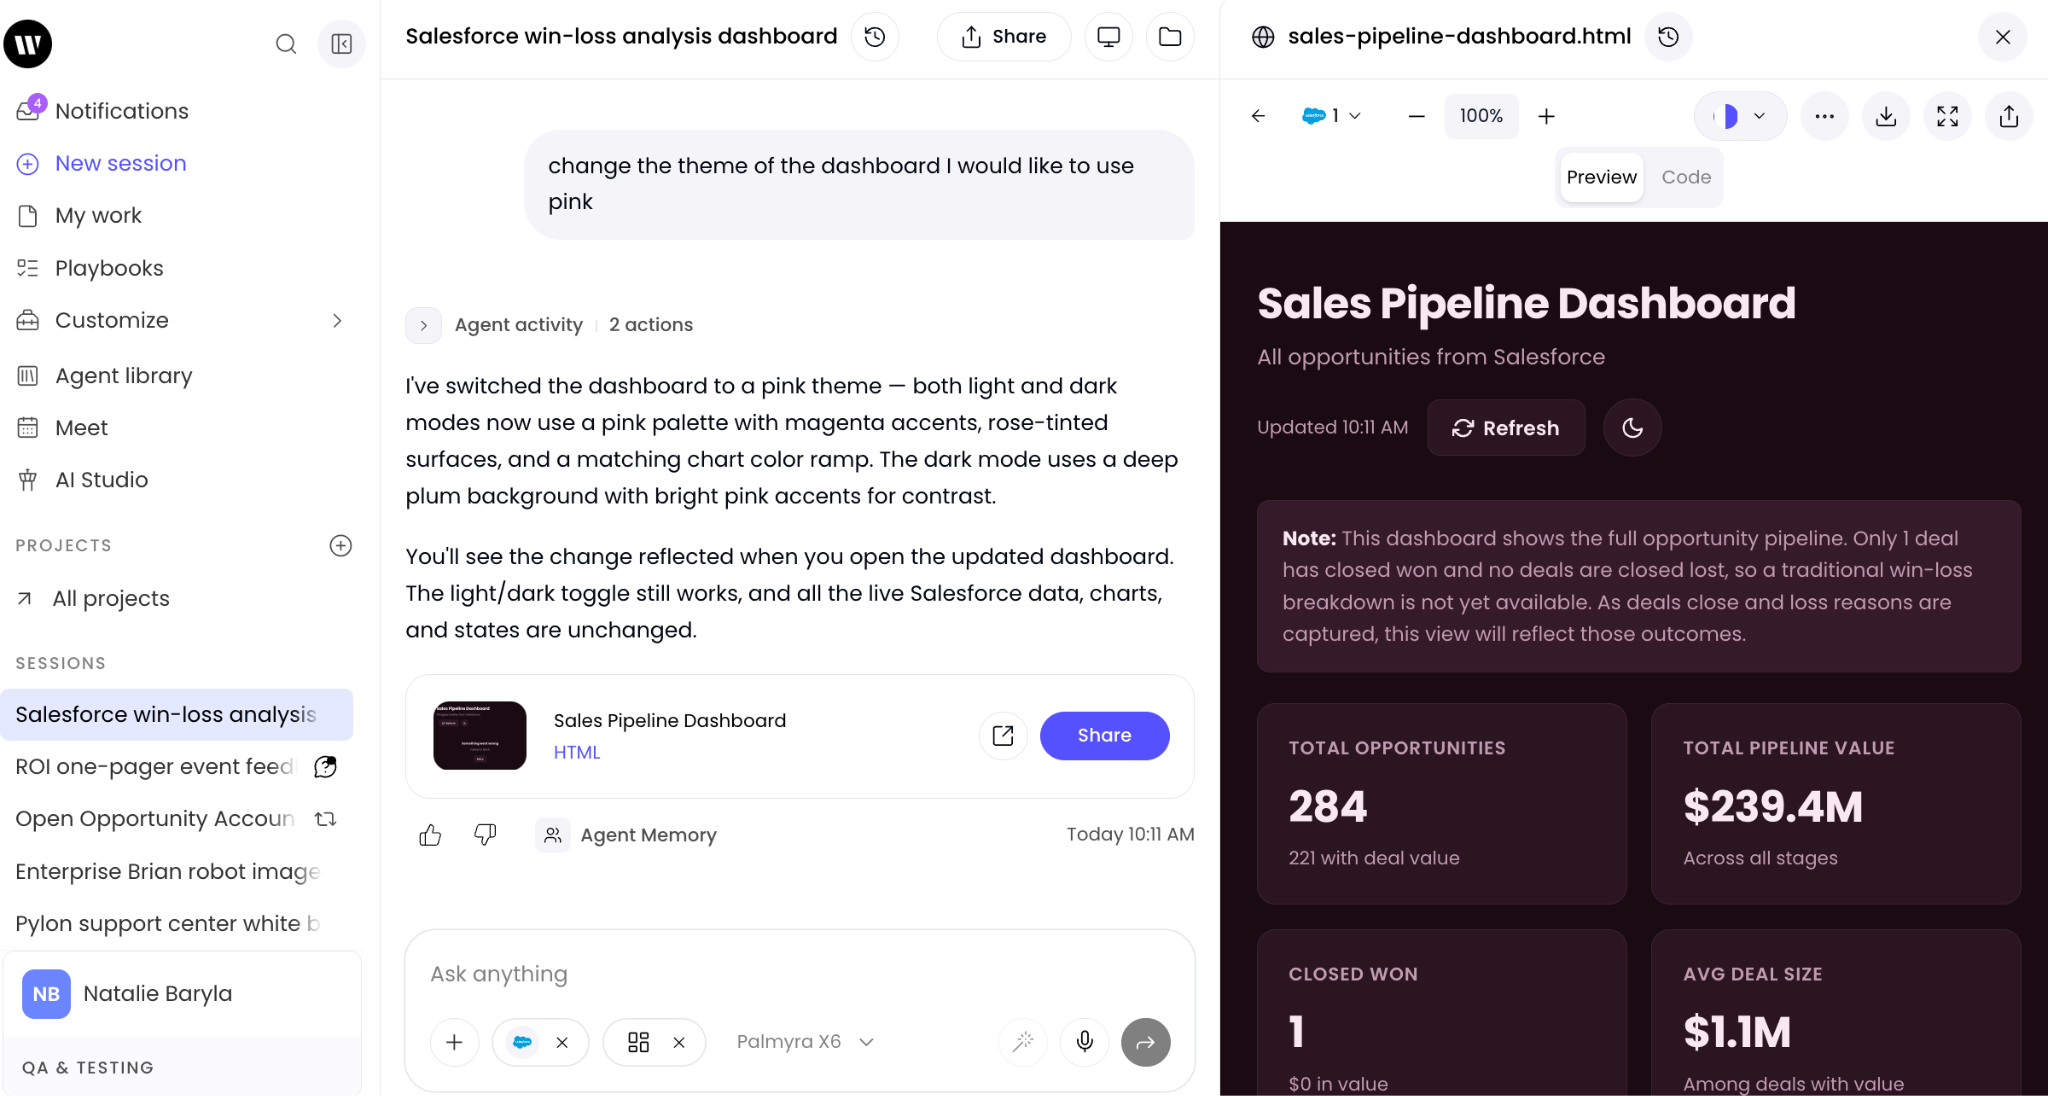
Open your existing dashboard and select the theme picker in the top right of the dashboard. You can also:
Ask WRITER Agent to change the theme of your dashboard.
Select a new theme from the available options.
The dashboard updates to reflect the new theme.
Note: Custom themes are coming soon.
Connecting live data sources
Dashboards can pull data from your connected data sources, including connectors, playbooks, and models. This allows your dashboard to display current information rather than static snapshots.
Connect the tools you need before or during the conversation.
Tell WRITER Agent which sources to use in your prompt.
After generation, open the dashboard and confirm the values update when the underlying data changes.
Supported data sources
You can connect dashboards to:
Connectors — Pull data from integrated applications like Google Sheets, Salesforce, or other connected services
Playbooks — Use outputs from your configured playbooks as data sources
Models — Generate or transform data using available models
How live data works
Dashboards can pull data from your connected data sources — connectors, playbooks, and models — so the dashboard displays current information rather than a static snapshot. Each source type behaves differently at runtime.
When you create a dashboard with live data:
WRITER Agent identifies the data sources needed for your request.
The dashboard connects to those sources and retrieves the current data..
Share settings from the original data sources apply to the dashboard.
Share settings control who can open the page (only you, specific people or teams, your organization, or a public link).
Data permissions (Set data permissions) control whose credentials the live data runs with — Shared (builder's connectors, everyone sees the same data) vs. Individual (each viewer's own connectors, results differ by viewer).
If live data cannot be configured for a page, the dashboard can still open as a static HTML page. That is expected when a source is missing or undeclared.
Note: you should have the following addresses whitelisted by your IT team to ensure dashboards remain accessible:
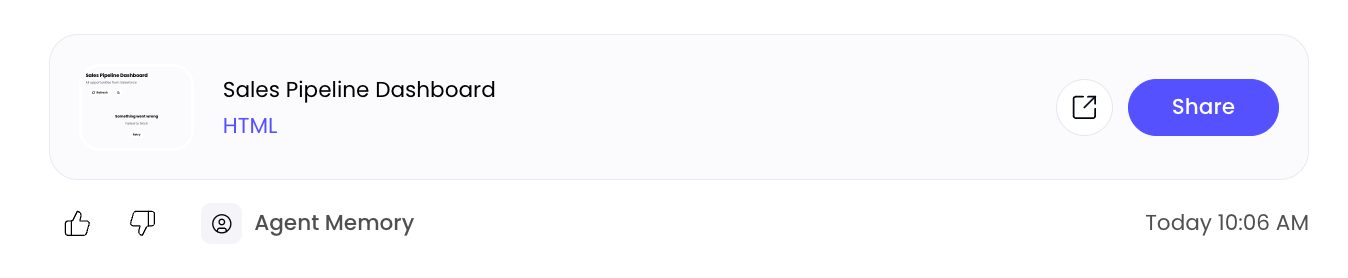
After WRITER Agent generates your dashboard, a deliverable card appears in the chat. This card provides key information about your dashboard at a glance.
Playbooks as a data source
When a dashboard uses a playbook as a data source, WRITER Agent executes a new run of that playbook and reads the deliverables from that run. The dashboard does not retrieve the output of a previous session, and the playbook does not need to be configured with special instructions to push data to the dashboard.
Note: Because the dashboard triggers a fresh playbook run, the data reflects the most recent execution rather than a cached or historical result.
Models as a data source
Adding a model as a data source allows the dashboard to call a Palmyra model at runtime. The model can run automatically when the dashboard opens, or it can be triggered on demand through an interactive element such as a button.
Tip: Use a button to trigger a model call on demand when you want the dashboard to load quickly and let viewers generate output only when they choose to.
Connectors as a data source
Dashboards can pull live data from connected applications such as Google Sheets, Salesforce, and other integrated services. Connector data is fetched at runtime so the dashboard reflects the current state of the connected source.
Triggering actions on demand
By default, a data source runs when the dashboard opens. You can also add interactive elements — such as buttons — that trigger a playbook run or a model call on demand. This is useful when you want the dashboard to load quickly and let viewers generate fresh output only when they need it.
Common on-demand patterns include:
A button that runs a playbook and surfaces the new deliverables in the dashboard.
A button that calls a specific Palmyra model to perform a task, such as generating suggested input for playbook variables.
A model that runs automatically on load to pre-populate the dashboard, with an additional button to re-run it on demand.
Tip: Combining a model with a playbook is a powerful pattern — use a model to generate suggested input for playbook variables, then trigger the playbook run from a button.
Persisting data in shared dashboards
Dashboards can use built-in storage to persist data. When a dashboard uses storage, changes and additions made by viewers are saved, so everyone with access to the shared dashboard sees the same updated data.
Note: Persistent storage is useful for shared dashboards where multiple viewers need to add or update data over time.
Sharing your dashboard
Each dashboard gets a durable, shareable link that you can send to others. Unlike sandboxed outputs, dashboards don't require waiting for a sandbox to wake up—they're immediately accessible.
How to share a dashboard
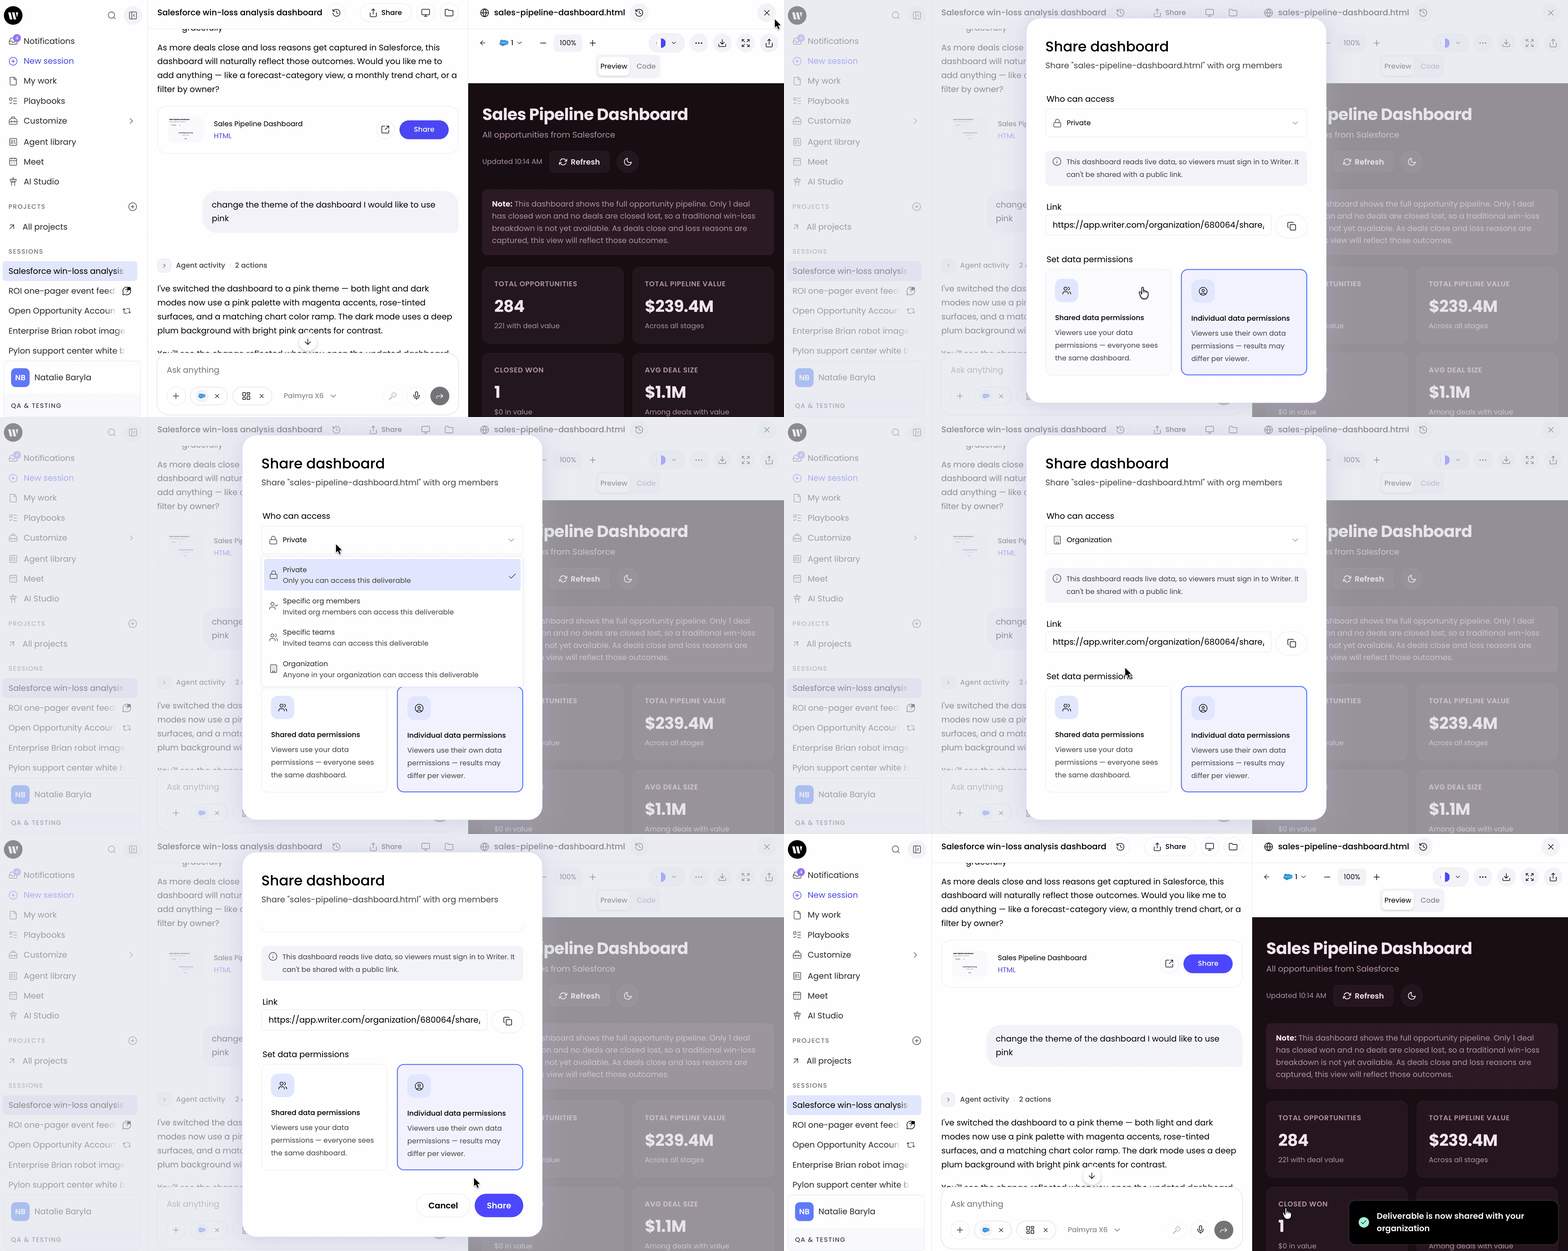
From your session, locate your dashboard in the chat or in your deliverables.
You can also find your dashboard via My Work > Dashboards.
Select the Share option to set permissions and then copy the dashboard link from the deliverable card.
Send the link to your intended recipients.
Recipients who select the link see the dashboard immediately.
Share settings
Share settings from your connected data sources apply to the dashboard. If you've restricted access to a connector or playbook, those restrictions carry over to dashboards that use that data.
Share settings control who can open the page (only you, specific people or teams, your organization, or a public link).
Data permissions (Set data permissions) control whose credentials the live data runs with — Shared (builder's connectors, everyone sees the same data) vs. Individual (each viewer's own connectors, results differ by viewer).
Editing a dashboard
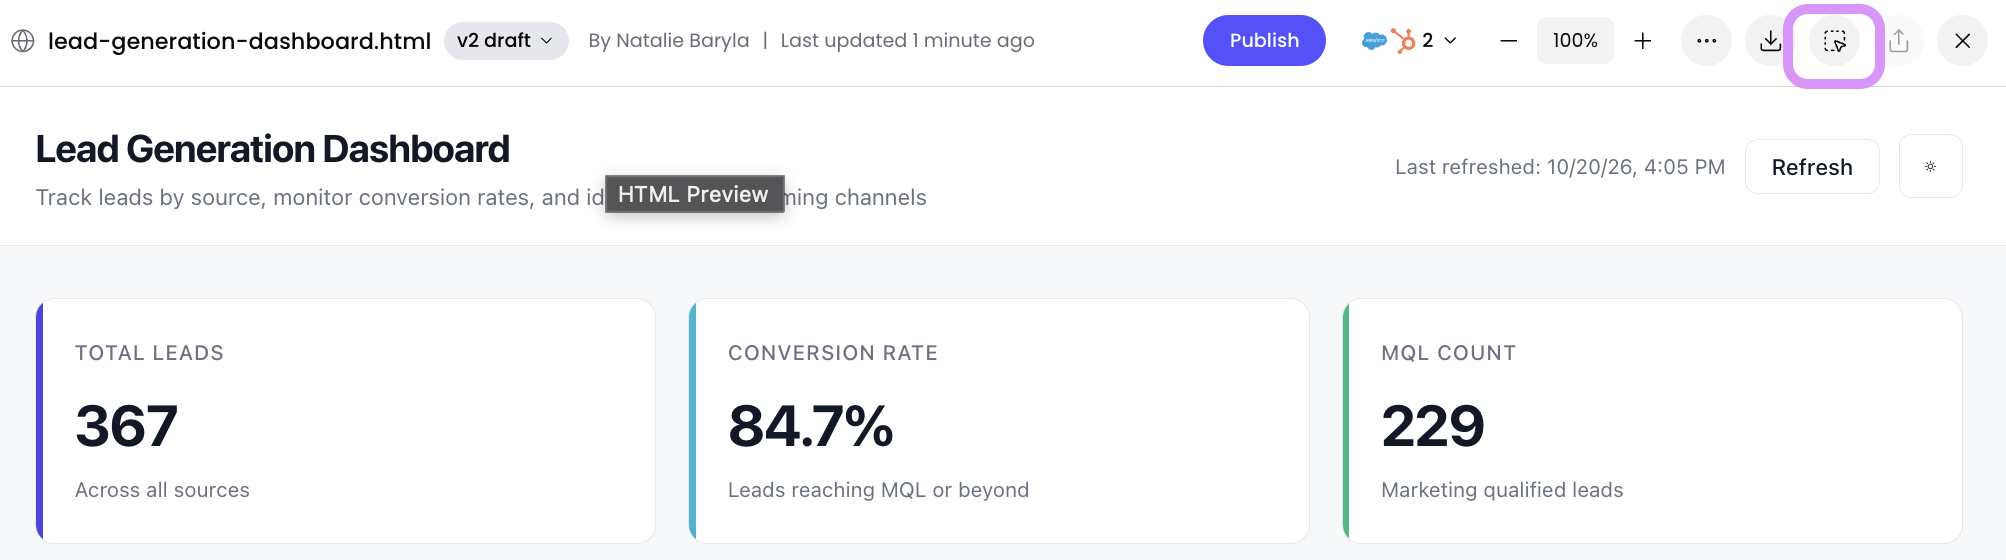
Once your dashboard has been generated, you can edit it via the same session or from the dashboard select the edit icon in the top right.
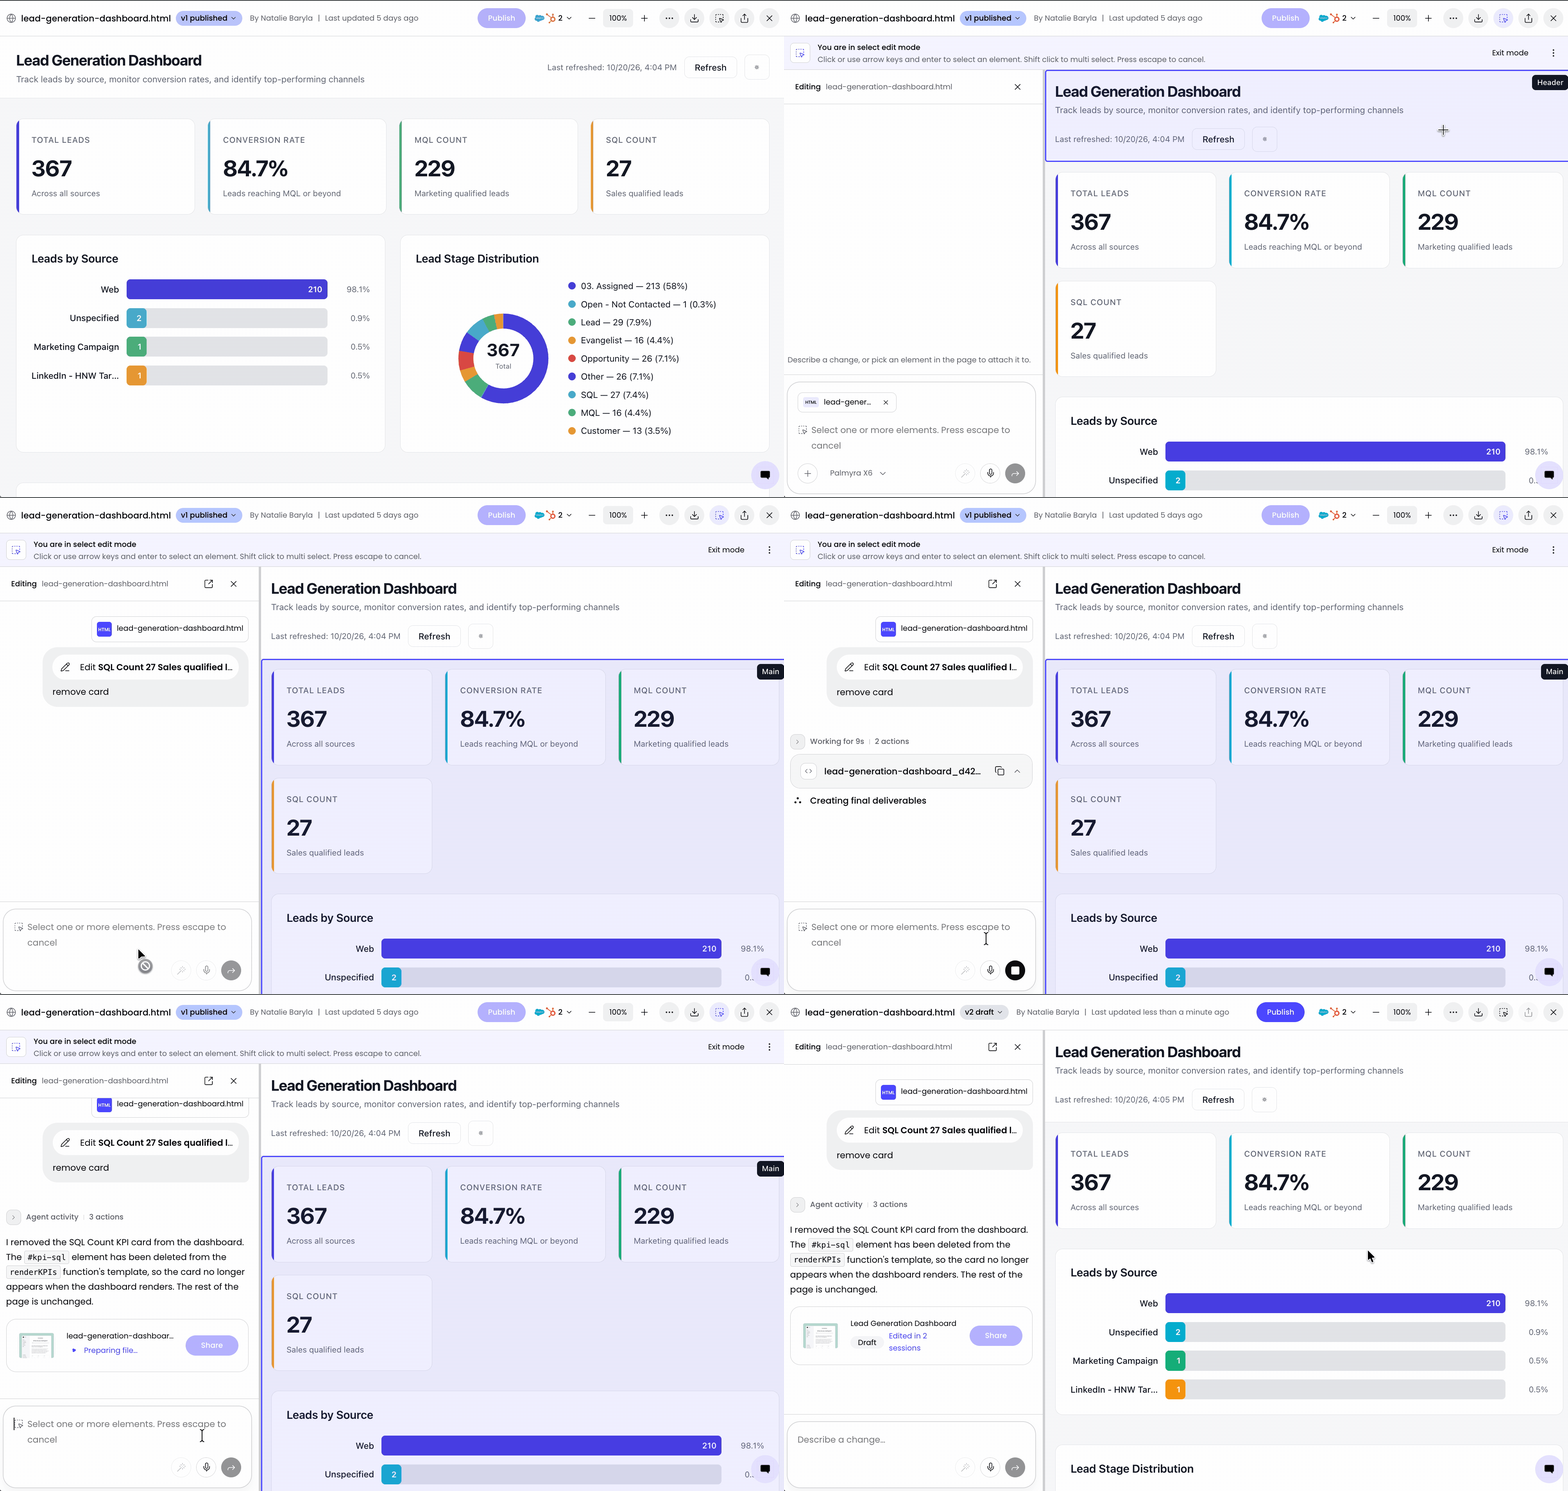
Once in edit mode use shift to select multiple areas or select just one and type your changes. WRITER Agent will then apply your changes to the preview on the right. Publish your dashboard to make the changes live for your dashboard viewers.
Tips for consistent results
Start with what you want to achieve — identify audience, main message, and desired outcome before prompting.
Calibrate your setup to your consistency needs — decide upfront how consistent output needs to be, then choose the right theme, skill, and playbook combination.
Be specific in your skill instructions — use exact hex codes, full font names, and concrete layout requirements (e.g., "Use background color #1A2B3C for the header, accent color #5551FF for KPI highlights, and Inter Bold for headings. Put four KPI cards across the top and a trend chart below.").
Create separate playbooks for different use cases — build a dedicated playbook for each distinct use case (e.g., "Weekly pipeline review," "Campaign performance," "Ops status board").
Let WRITER Agent validate your skill automatically — run /skill-creator to let the agent check instructions for formatting and metadata issues.
Refine one change at a time — use specific, targeted feedback (e.g., "On the revenue chart, switch to a line chart and move the KPI cards above it.") rather than broad redo requests.
Prefer live connectors when the page should stay current — attach connectors or Playbooks for dashboards that need to stay up to date; use uploaded files for one-time analysis.
Use cases
Not sure where to start? Browse the use cases below to start exploring what dashboards you can build.
Sales and revenue
Pipeline overview — Pull opportunities from Salesforce to show deal stages, values, and close dates. Filter by rep, region, or quarter.
Quota attainment tracker — Compare individual and team performance against targets using CRM data.
Win-loss analysis — Visualize closed-won vs. closed-lost deals by reason, competitor, or deal size.
Marketing
Campaign performance — Connect Google Sheets or your marketing platform to show spend, clicks, conversions, and cost-per-across channels.
Content engagement — Display page views, time on page, and conversion rates for published content.
Lead funnel — Track leads from acquisition through qualification to conversion.
Finance and operations
Budget vs. actuals — Pull financial data to compare planned spending against actuals by department or category.
Cash flow snapshot — Visualize inflows and outflows over time using accounting connector data.
Vendor spend dashboard — Aggregate spending across suppliers to identify cost-saving opportunities.
Customer success
Account health — Combine usage data, support tickets, and NPS scores to flag at-risk accounts.
Support metrics — Show ticket volume, resolution time, and CSAT trends from your support connector.
Renewal pipeline — Track upcoming renewals with contract value, renewal date, and health status.
Product and engineering
Feature adoption — Visualize how many users engage with specific features over time.
Release status board — Track deployed features, open issues, and sprint progress.
Error rate monitoring — Pull error logs to display frequency, type, and affected services.
Team productivity
Playbook performance — Show how often playbooks run, their outputs, and turnaround times.
Workload distribution — Visualize task assignments and completion rates across team members.
Deliverable output tracker — Monitor the volume and type of deliverables produced over a period.
Executive reporting
OKR progress — Combine data from multiple sources to show objective completion across the organization.
Weekly business review — Pull KPIs from sales, marketing, and finance into a single shareable view.
Board-ready summary — Use WRITER themes to present key metrics in a polished format suitable for leadership.
FAQs
How do I access the dashboards feature?
Type /dashboard in any chat with WRITER Agent, or select Dashboard from the + (plus) menu in the chat input area.
Note: you should have the following addresses whitelisted by your IT team to ensure dashboards are accessible when shared:
Can I edit a dashboard after it's created?
Yes you can chat with WRITER Agent in the same session you created the dashboard in to make changes at any time. Additionally, you can use the dashboard in a new session to edit without impacting the original dashboard.
What's the difference between dashboards and presentations?
Dashboards are interactive data visualizations with live data connections and shareable links. Presentations are slide-based content for communicating narratives.
Do viewers need a WRITER account to see my dashboard?
This depends on the sharing settings allowed by your admin team. If allowed you will have the option when sharing to share the dashboard with those outside of your WRITER org.
Can I use custom themes for my dashboards?
Custom themes are not yet available but are coming soon. Currently, you can choose from six built-in themes: Default, Ocean blue, Forest green, Sunset, Rose, and Slate.
What happens if my data source is disconnected?
If a connector or data source becomes disconnected after you create a dashboard, the dashboard may display stale data or show an error for the affected visualizations. Reconnect the data source to restore live data.
What is the difference between a theme and a skill?
A theme sets the visual foundation (colors, fonts) through the preset picker or by asking WRITER Agent. A skill contains design rules, layout preferences, and other instructions in plain language. Using both gives the best consistency.
What is the difference between a skill and a playbook?
A skill captures rules and logic for how WRITER Agent should build a dashboard. A playbook is the workflow that determines when and how to run that process (what data to pull, what inputs to collect, what steps to follow). Build and test your skill before creating a playbook that uses it.
What is the difference between Shared and Individual data permissions?
Shared runs live data with the builder's connectors so every viewer sees the same results. Individual runs live data with each viewer's own connectors, so results can differ and each viewer needs that connector set up.
Why can't my teammate open the link?
Check the share settings. The link only works for people allowed by the current access setting. Update who can access the dashboard, then have them try again.
Can I change the theme after I create a dashboard?
Yes. Ask WRITER Agent to apply a different preset theme, or open the HTML deliverable in preview and use the Dashboard theme picker. You can also ask WRITER Agent to follow your organization's Assets or style guide.
Why does it take time to generate my dashboard?
Dashboard generation involves reasoning through content, laying out charts and sections, and wiring live data sources. Clear prompts, skills, and playbook steps speed things up.
How do I make my dashboards accessible?
Add accessibility requirements directly to your skill instructions. Specify a minimum text contrast ratio (e.g., 4.5:1), a minimum font size, and a requirement that all charts include clear data labels.
Does WRITER train its models on my dashboard data?
No. WRITER does not train its LLMs with customer data. WRITER adheres to global privacy laws and security standards.
When a dashboard uses a playbook as a data source, does it read the playbook's most recent output?
No. The dashboard executes a new run of the playbook and reads the deliverables from that run. It does not retrieve the output of a previous session.
Does a playbook need special instructions to send data to a dashboard?
No. The dashboard triggers the playbook run directly. You do not need to configure the playbook to push data to the dashboard.
Can a dashboard run a playbook or model on demand instead of every time it opens?
Yes. You can add interactive elements such as buttons that trigger a playbook run or a model call only when a viewer selects them.
What does it mean to add a model as a data source?
Adding a model as a data source allows the dashboard to call a Palmyra model at runtime. The model can run automatically when the dashboard opens, or it can be triggered on demand through a button or similar interactive element.
Can changes made to a shared dashboard persist for other viewers?
Yes. Dashboards can use built-in storage to persist data, so changes and additions made by one viewer are saved and visible to everyone with access to the dashboard.