Playbook reporting and governance
Last updated: July 16, 2026
Who can use this feature
Org admins, IT admins, and AI Studio full access admins. Custom org-level roles can be granted access by an existing org admin.
Overview
Playbook reporting and governance gives you dedicated visibility and control over every playbook running in your organization, from the ones your team built to the ones other teams have published. You get two distinct views: an Analytics tab that shows you usage and cost data, and a Governance tab that gives you the controls to manage playbooks at scale.
Together, these two views answer the most important operational questions about playbooks: Which ones are being used? Which ones are driving costs? Who owns each one? And what do I do when a playbook is no longer appropriate for our standards?
As your playbook library grows, these pages become your primary tool for keeping that library healthy, performant, and aligned to organizational priorities.
How to access playbook analytics and governance
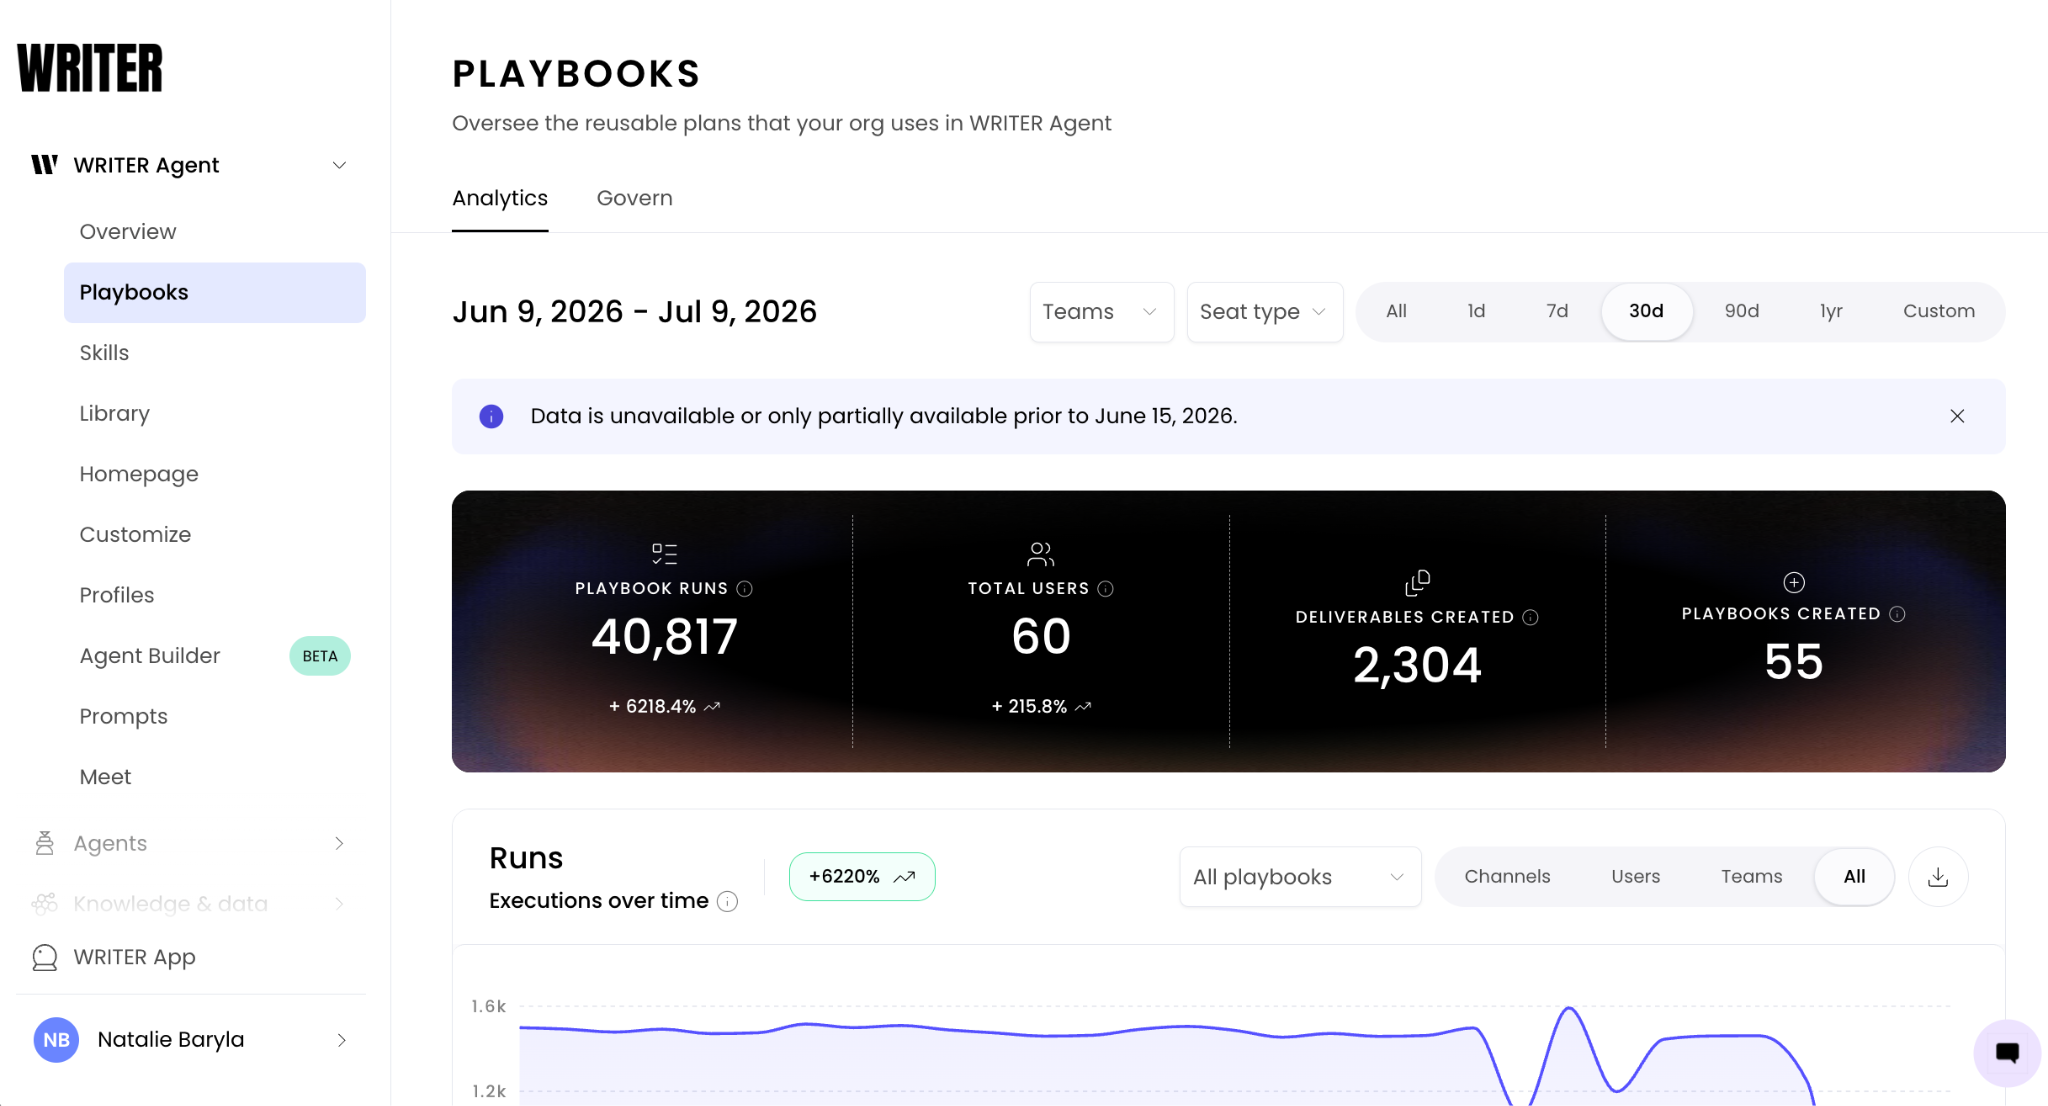
Navigate to AI Studio > WRITER Agent > Playbooks and you’ll see two sub-tabs: Analytics and Governance.
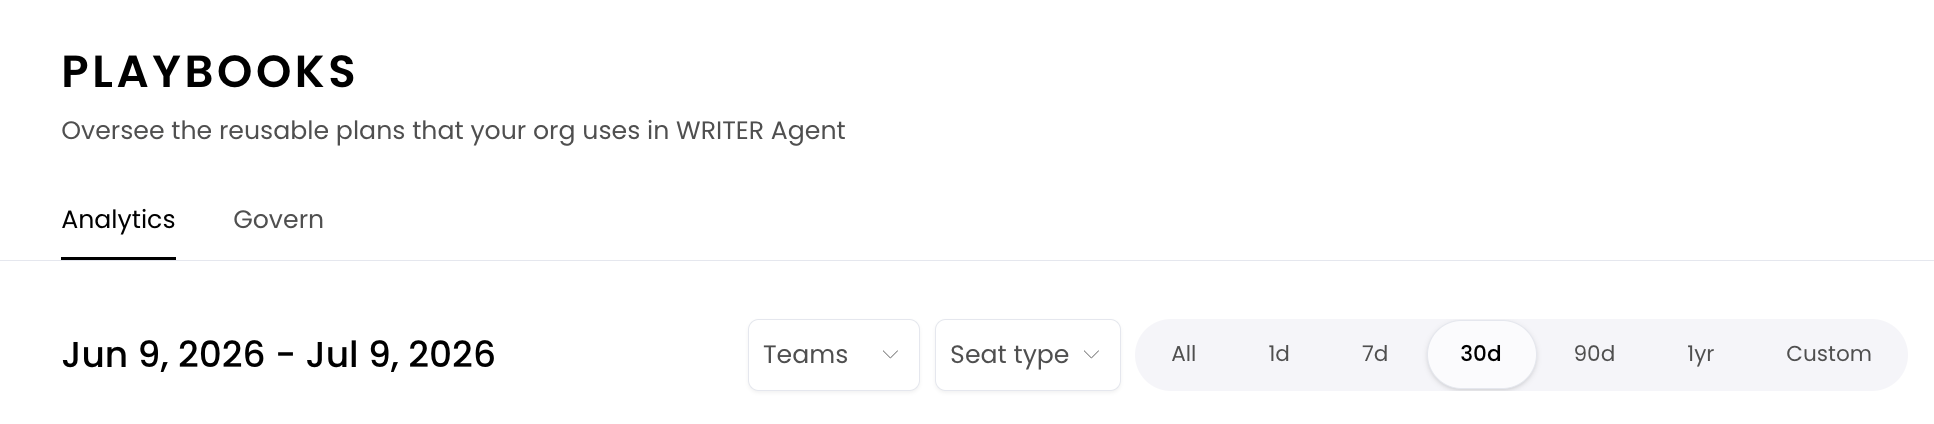
From the analytics page you can view playbooks by teams or user seat type (pro and lite) or use the date picker to filter down to a specific time.
Playbook analytics
The Analytics tab gives you a usage and cost overview of all playbooks in your organization.

Overall playbook runs
The total number of playbook executions across the organization in your selected time period. This is your headline volume metric, it tells you how actively your teams are running automated workflows through WRITER Agent.
Runs by playbook
A breakdown of execution counts at the individual playbook level. This lets you move beyond aggregate totals to understand which specific playbooks are being run, how often, and by how many users.
Most-used playbook leaderboard
Playbooks ranked by total run count in the selected period. The most-used playbooks are your highest-value workflows, the ones your teams have decided are worth automating and are actually running repeatedly. This leaderboard is your starting point for identifying which playbooks deserve ongoing investment and which might benefit from a dedicated team library promotion.
Highest-cost playbook leaderboard
Playbooks ranked by estimated token cost in the selected period. High-cost playbooks aren't necessarily a problem, a complex, high-value workflow that runs frequently should consume tokens. But unexpected cost spikes, or high-cost playbooks with low run counts, are signals worth investigating.
💡 Pro-Tip: Cross-reference the most-used leaderboard with the highest-cost leaderboard. A playbook that ranks highly on both lists is a strong candidate for optimization work. Small efficiency improvements in a high-volume, high-cost workflow can generate significant savings.
Playbook governance
The Govern tab gives you a complete inventory of every playbook created across the organization, along with the controls to manage them.
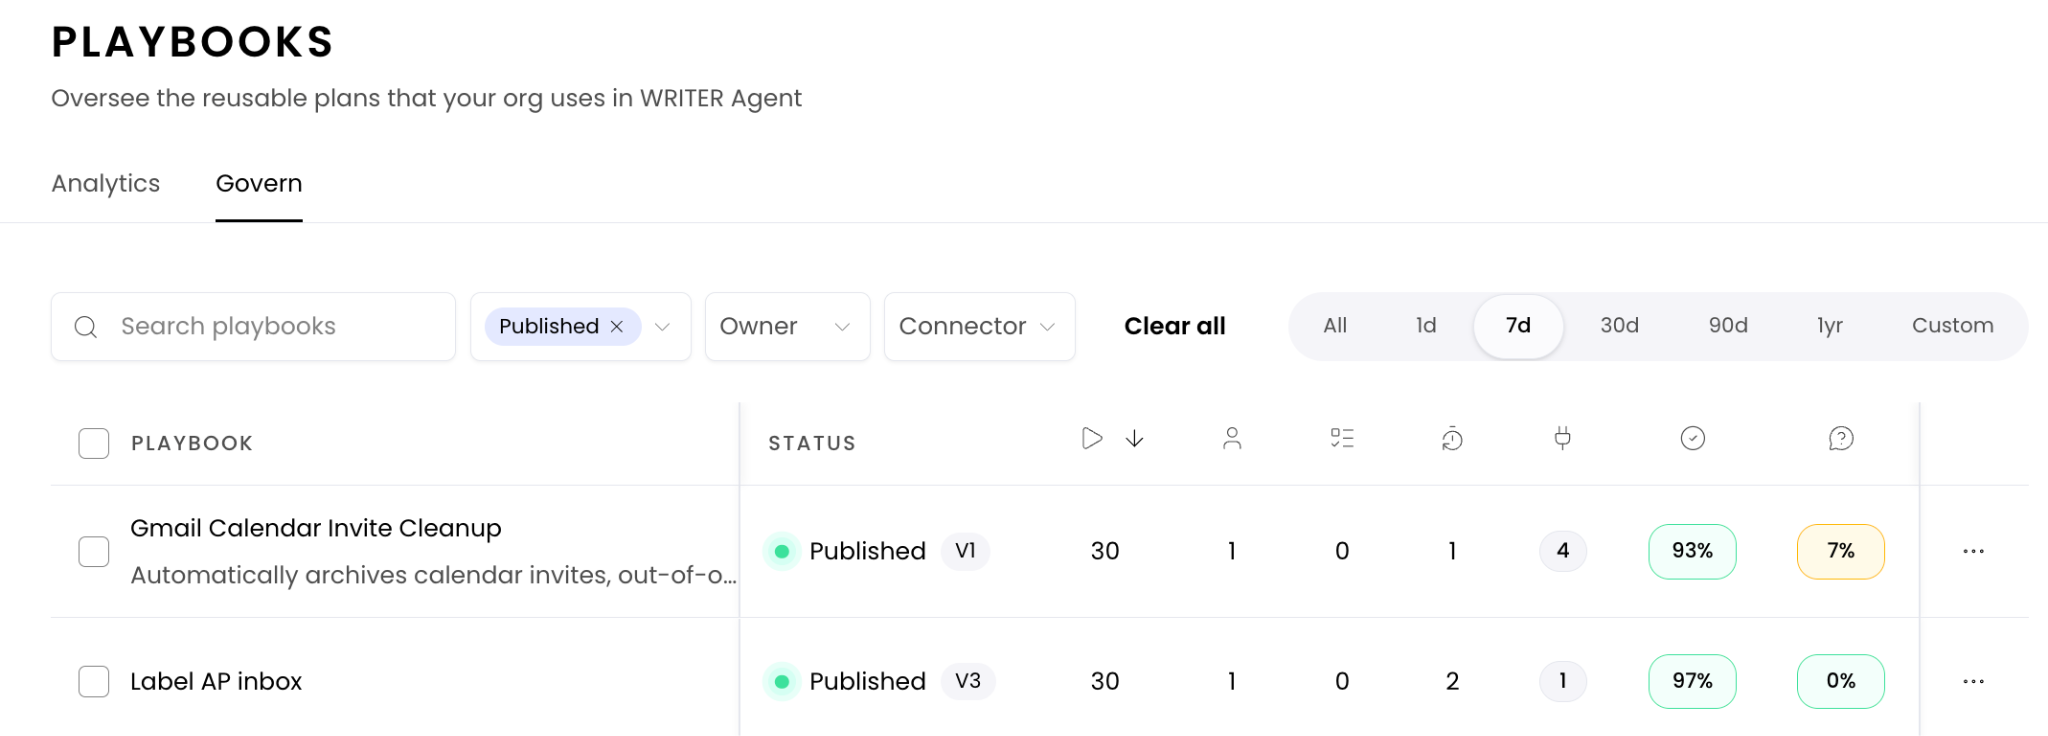
From above the playbooks table you have the following options:
Search playbooks — a text search field to find any playbook by name across the full org inventory
Status dropdown — filter by playbook status (Active, Draft, Disabled) to quickly see only the playbooks in a given state
Owner dropdown — filter by owner to scope the view to playbooks belonging to a specific user, which is especially useful during offboarding audits
Connector dropdown — filter by connector to see all playbooks that reference a specific integration in their published version
The table here is far richer than a simple list of playbooks. Each row represents one playbook and surfaces distinct data points alongside its name and owner.
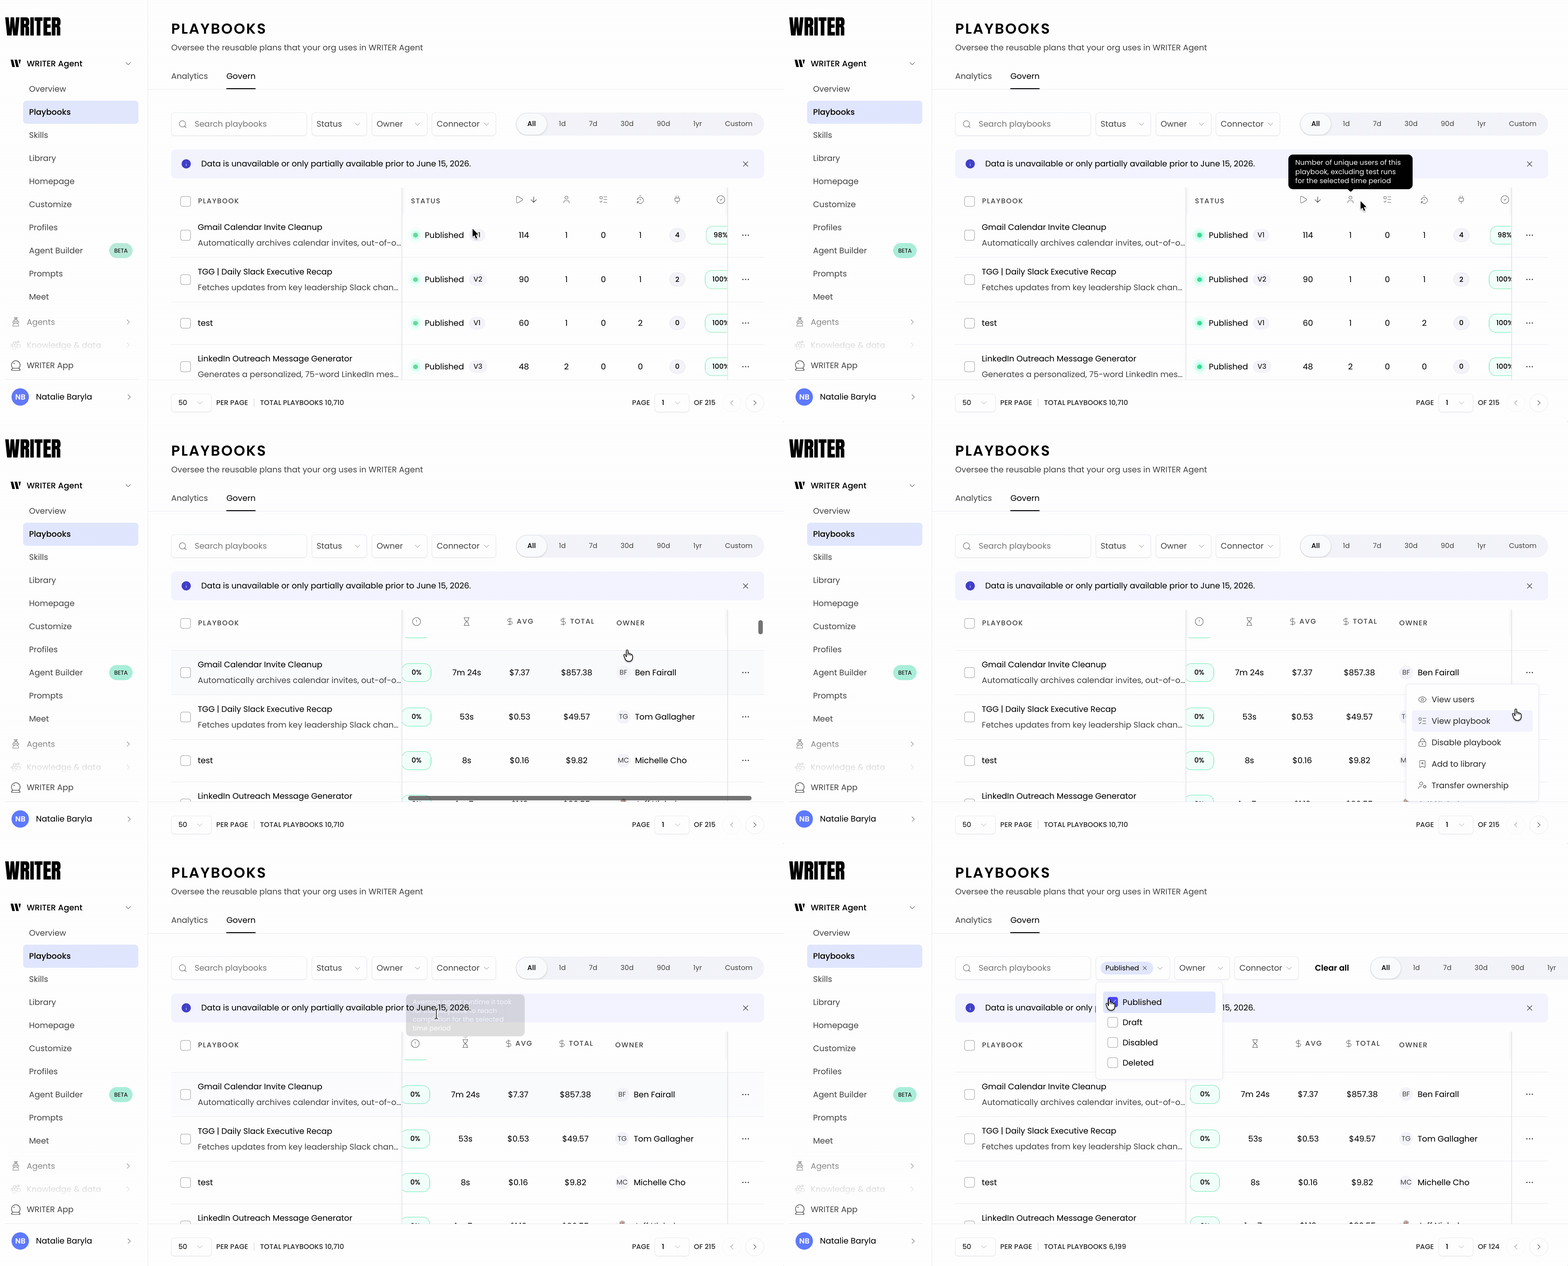
PLAYBOOK
The playbook name. Each row shows the name of the playbook as created by its owner. Use the Search playbooks field to find a specific one quickly in a large inventory.
STATUS
The current lifecycle state of the playbook. Statuses include:
Active — the playbook is live and available for users to run
Draft — the playbook exists but has not yet been published; it is not available for general use
Disabled — the playbook has been turned off by an admin and can no longer be executed
The status dot indicator to the left of the status label gives you a quick visual read across the entire table.
Runs (▷↓)
"Number of runs of this playbook, excluding test runs for the selected time period."
This is your primary volume metric at the playbook level. It excludes test runs, so it reflects real production usage only. High run counts confirm that a playbook is embedded in genuine workflows. Low run counts on a published, active playbook signal that the workflow may be underpromoted, redundant, or no longer needed.
Unique users (👤)
"Number of unique users of this playbook, excluding test runs for the selected time period."
Like the runs column, this excludes test runs. A playbook with a high run count but a low unique user count is being driven heavily by a small number of people — which may represent a concentration risk or an opportunity to expand awareness of a high-value workflow to more of the team.
Connected playbooks (☰)
"Number of all playbooks that call this playbook."
This column measures how many other playbooks in the organization reference this one — that is, how many workflows chain into it. A high connected playbook count means this playbook is a structural dependency. Changes to it, or disabling it, can have a cascading effect across multiple other workflows. Always check this number before taking any governance action on a playbook.
Triggers (🕐)
The Triggers column shows how many scheduled or event-based triggers are configured for this playbook. A value greater than zero means the playbook is running on an automated schedule, not just when users manually invoke it.
Connectors (⚡)
"Number of connectors referenced by this playbook's published version."
This column shows how many external integrations the playbook's published version depends on. A playbook with multiple connectors has more external dependencies and more points of potential failure if a connector is reconfigured, revoked, or experiences downtime. Use this column alongside the Connector filter in the toolbar to audit which playbooks depend on a specific integration.
Completion rate (✓)
"Percentage of playbook runs that reached completion for the selected time period."
Displayed as a percentage badge (e.g. 100%, 72%), this is your primary quality metric for each playbook. A completion rate below 100% means some runs are failing to finish. The lower the rate, the more urgent the investigation. A playbook with a high run count and a low completion rate is actively producing failures at scale.
Human intervention rate (?)
"Percentage of playbook runs that produced at least one human intervention request for the selected time period."
This column shows how often the playbook pauses and asks a human to step in before completing. A non-zero human intervention rate isn't always a problem — some playbooks are designed to include a review step. But a high rate on a playbook that should be fully automated signals that something in the workflow is regularly hitting a decision point it can't resolve on its own.
Error rate (!)
"Percentage of playbook runs that produced at least one error for the selected time period."
This column surfaces playbooks that are generating errors in production. Even a small error rate on a high-volume playbook can represent a significant number of failed runs. Cross-reference this with the runs column to understand the absolute scale of errors, not just the percentage.
Runtime (⌛)
"Average agent runtime it took for this playbook to reach completion for the selected time period."
Displayed in minutes and seconds (e.g. 1m 17s), this column tells you how long the playbook typically takes to run end-to-end. Unexpectedly long runtimes may indicate an inefficient workflow design, a slow connector dependency, or a step that's doing more work than intended. Compare runtime across similar playbooks to identify optimization opportunities.
$ AVG
"Average cost of executing this playbook to completion for the selected time period. Costs are estimated. Visit billing and consumption for detailed usage and spend."
The average token cost per completed run (e.g. $1.00). Use this alongside the runs column to understand per-run economics. A playbook with a high average cost that runs thousands of times per month deserves close attention in your cost management review.
$ TOTAL
"Total cost of all playbook runs in this time period for the selected time period. Costs are estimated. Visit billing and consumption for detailed usage and spend."
The aggregate estimated token cost for all runs of this playbook in the selected period (e.g. $39,897.39). This is your most direct cost visibility metric at the playbook level. Sort by $ TOTAL to immediately see which playbooks are driving the most spend and use it as your primary input for pre-billing cost reviews.
⚠ Note: All cost figures are estimates. Visit the billing and consumption pages for detailed usage and spend. Use cost data for trend analysis and relative comparisons, not as a direct substitute for billing reconciliation.
OWNER
The user currently responsible for the playbook, shown with their avatar and name. Owner visibility is essential for governance: when a playbook needs to be updated, when it's producing errors, or when a user leaves the organization, this column tells you exactly who to contact or whose ownership to transfer.
⚠ Note: Before disabling a playbook, check whether it is actively used by other teams or referenced in downstream workflows. The Unique users column on the Governance tab gives you a quick signal of how broadly a playbook is in use.

To access actions for any playbook, select the three dot icon at the right end of its row.
View users
Opens a view of all users who have run this playbook. Use this to understand who depends on the playbook before making changes, and to identify the users who will be affected if you disable it.
View playbook
Opens the playbook's full configuration and details. Use this to review what the playbook does, how it's built, and whether it meets your organization's current standards before deciding whether to keep it active, promote it, or disable it.
Disable playbook
Turns off the playbook so it can no longer be executed by any user. Once disabled, the playbook is no longer available to run. It remains visible in the Govern table in a Disabled state — disabling is not the same as deleting, and it is reversible.
⚠ Note: Before disabling a playbook, check the Connected playbooks and Triggers columns. A playbook with active triggers will stop running on its schedule. A playbook with connected playbooks may cause other workflows that chain into it to fail. Review both dependencies and coordinate with affected owners before disabling.
Add to library
Promotes the playbook to a team library so that other teams can discover and use it as an approved starting point. This is your primary lever for scaling proven workflows across the organization. When a playbook has demonstrated strong adoption, high completion rates, and consistent usage, adding it to a broader team library makes it the standard for other teams doing similar work, reducing duplication and elevating quality.
Transfer ownership
Reassigns the playbook from its current owner to a new user. Use this when the original creator changes roles, moves to a different team, or leaves the organization. Transferring ownership before an account is deactivated prevents the playbook from becoming owned by an inactive user who can no longer update or manage it.
💡 Pro-Tip: When a team member leaves, open the Govern tab, filter by their name in the Owner dropdown, and review every playbook they own in one focused view. Transfer each one before their account is deactivated, paying particular attention to any playbook with a non-zero Triggers count or a high Connected playbooks count.
Questions you can answer with this data
"Which playbooks are actually being used?"
The most-used leaderboard on the Analytics tab ranks playbooks by run count. Playbooks that don't appear or appear at the bottom are candidates for review. They may be underperforming, hard to find, or simply no longer relevant.
"Which playbooks are driving cost?"
The highest-cost leaderboard on the Analytics tab ranks playbooks by estimated token consumption. Use this before every billing cycle to understand what's driving spend and where optimization opportunities exist.
"Is this playbook being used by more than one person?"
The Unique users column on the Governance tab shows how many distinct users have run each playbook. A playbook with high runs but low unique users may be heavily used by one power user, a signal that broader adoption may be possible with a library promotion or internal communication.
"Who owns this playbook, and are they still at the company?"
The Owner column on the Govern tab shows the current owner of every playbook. Cross-reference with your HR offboarding process to catch any playbooks owned by departed users before they become ungoverned.
"Are there duplicate or competing playbooks solving the same problem?"
The full inventory view on the Governance tab lets you browse all playbooks across the organization. Look for similar names or overlapping use cases — these are consolidation opportunities that reduce confusion and focus token consumption on the best version of the workflow.
Best practices
Establish a regular playbook review cycle.
Schedule a quarterly review of playbook inventory. Sort by unique users and identify playbooks with zero or near-zero usage. Investigate whether they're worth keeping active, and disable those that no longer serve a purpose.
Own the offboarding connection.
Work with HR or IT to add a playbook ownership transfer step to your standard employee offboarding process. Before any user's account is deactivated, transfer ownership of their playbooks to their manager or a designated successor. This is the single most important governance habit you can establish.
Use the highest-cost leaderboard as your pre-billing checklist.
In the week before your billing cycle closes, open the highest-cost leaderboard and review the top five to ten playbooks. For each one, ask: Is this cost expected given the run volume? Has usage changed significantly from the prior period? If anything looks unusual, investigate before the invoice arrives rather than after.
Promote proven playbooks into team libraries.
The Add to team library action is your primary lever for scaling ROI across the organization. When you identify a playbook with strong adoption, high unique user counts, and consistent usage, that's your signal to elevate it from a user-specific asset to a team-wide resource.
Use the Governance tab as your source of truth for the playbook inventory. Don't rely on team-level lists or spreadsheets to track what playbooks exist. The Govern tab shows everything across all teams, owners, and statuses in one place.
Disable before you delete.
Disabling a playbook removes access without removing your record of what existed. This is the right default action when you're uncertain whether a playbook is truly unused, a disabled playbook can be re-enabled if you discover it was still needed.
Data availability and cost estimates
Data start date: Reporting data is fully available starting from June 15, 2026. Data from before this date may be incomplete.
Cost estimates: All cost figures on the Playbook Analytics tab are estimates. They may differ from the final consumption accounting on your invoice. Use cost data for trend analysis and playbook-level comparisons — not as a direct substitute for billing reconciliation. A tooltip on cost data points provides additional context.
FAQs
Who can access Playbook Reporting and Governance?
Org admins, IT admins, and AI Studio full access admins have full access. Custom org-level roles can be granted the permission by an existing org admin.
What is the difference between the Analytics tab and the Govern tab?
The Analytics tab shows usage and cost data such as run counts, leaderboards, and token consumption estimates. The Govern tab shows the full org-wide playbook inventory and provides the controls to transfer ownership, disable playbooks, or add them to team libraries.
What happens to a playbook when I disable it?
A disabled playbook can no longer be executed by any user. It remains visible in the Govern tab inventory, so you retain a record of its existence. Disabling is reversible, you can re-enable the playbook if needed.
Is the cost data on the Analytics tab exact?
No. Cost data is an estimate and may differ from your final invoice. Use it for trend analysis and relative comparison between playbooks, not as a billing statement.
How do I find a specific playbook in the Govern tab?
Browse the full playbook inventory on the Govern tab. The table is sortable by name, owner, status, and unique users, making it straightforward to locate a specific playbook.
What does the "Unique users" column tell me?
Unique users shows how many distinct individuals have run that playbook. High unique user counts indicate broad adoption. Low counts on a high-run playbook suggest a small number of heavy users which may represent an opportunity to expand awareness of that workflow.
How far back does playbook analytics data go?
Data is fully available starting from June 15, 2026. Data from before that date may be incomplete.
Can playbook builders see their own analytics?
Not at this time. Our team is currently working on this ability and will release it in the near future.